In the previous post, we reviewed methods to generate User and Movie embeddings given a set of (User, Move, Rating) tuples. In that post, we showed that Alternating Ridge Regression (ARR) gives good model performance for 2D embeddings. Since 2D embeddings are easily plotted, I fit 2D User and Movie embeddings on 1 million ratings MovieLens dataset and created an interactive map to explore how different User embeddings affect a hypothetical user’s favorite and least favorite movies.
The Map
Click the below map to set a user vector. The direction of that vector determines which movies your hypothetical user prefers. Clicking in the lower left for example puts Dumb and Dumber at the top of your list and Desperately Seeking Susan at the bottom of your list.
Discussion
To get a feel for how this works, clicking the exact origin [0,0], gives movie rankings with zero user bias. Clicking just off the origin gives movie rankings combined with the user’s mild preferences. Clicking very far from the origin gives movie rankings when a user is very biased in a specific direction.
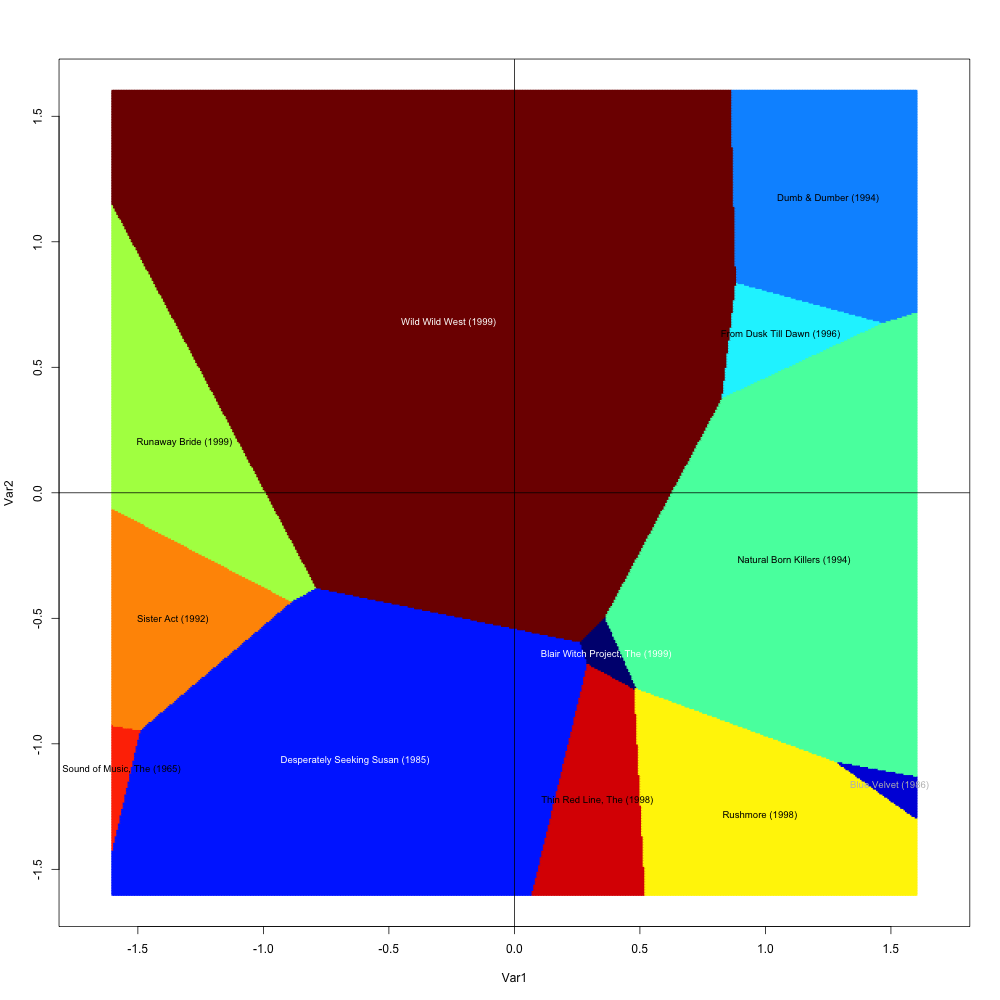
All top movies charted
If you click everywhere in the above plot and record the top movie at each point, you’ll get the following map. Click into the image for the full resolution.
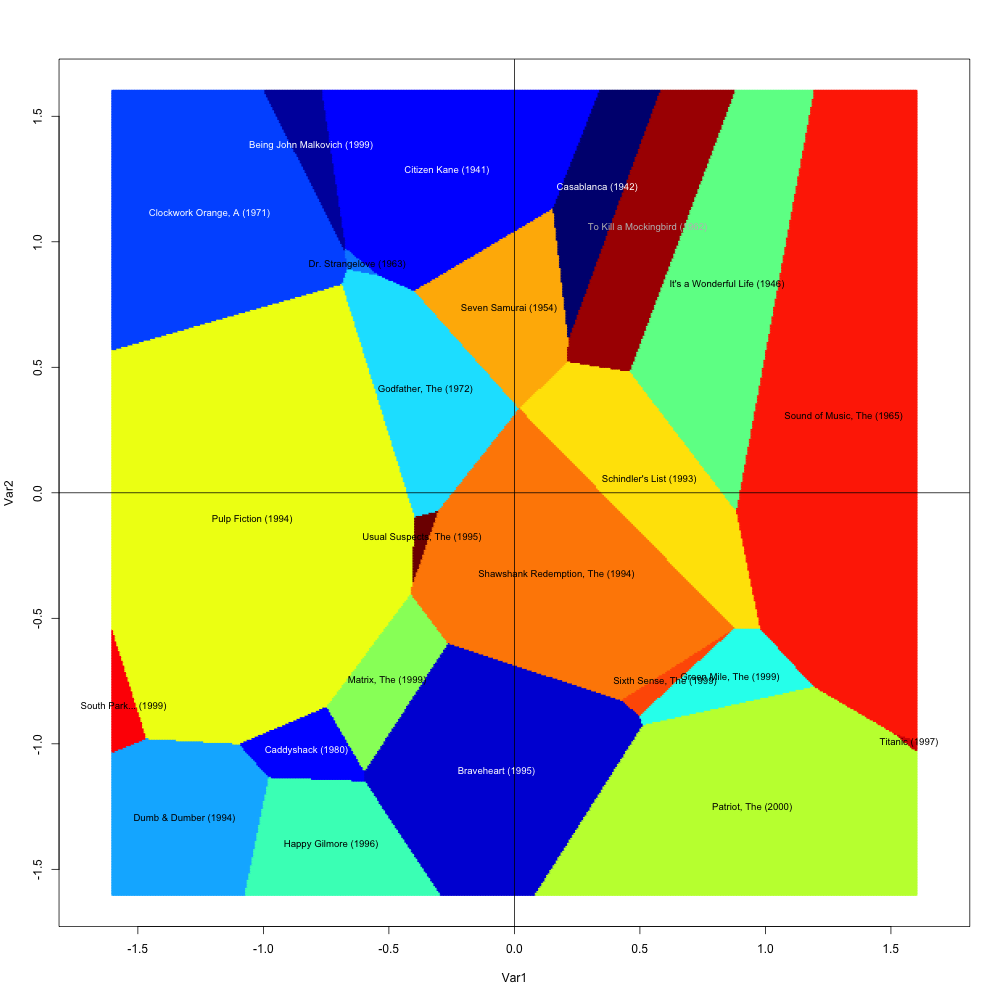
All bottom movies charted
Doing the same thing with the bottom movies gives the following map. Click into the image for the full resolution.